Campari Italia (@campari.it) Instagram stats

Snapshot from November 17, 2026. See the current report

Compared with November 12, 2026

@campari.it
Brand · 96.2K followers · Beer, Wine & Spirits

Posts center on cocktails, cinema events, and creative profiles, arriving about twice a week. No red flags are listed.

What the profile is about

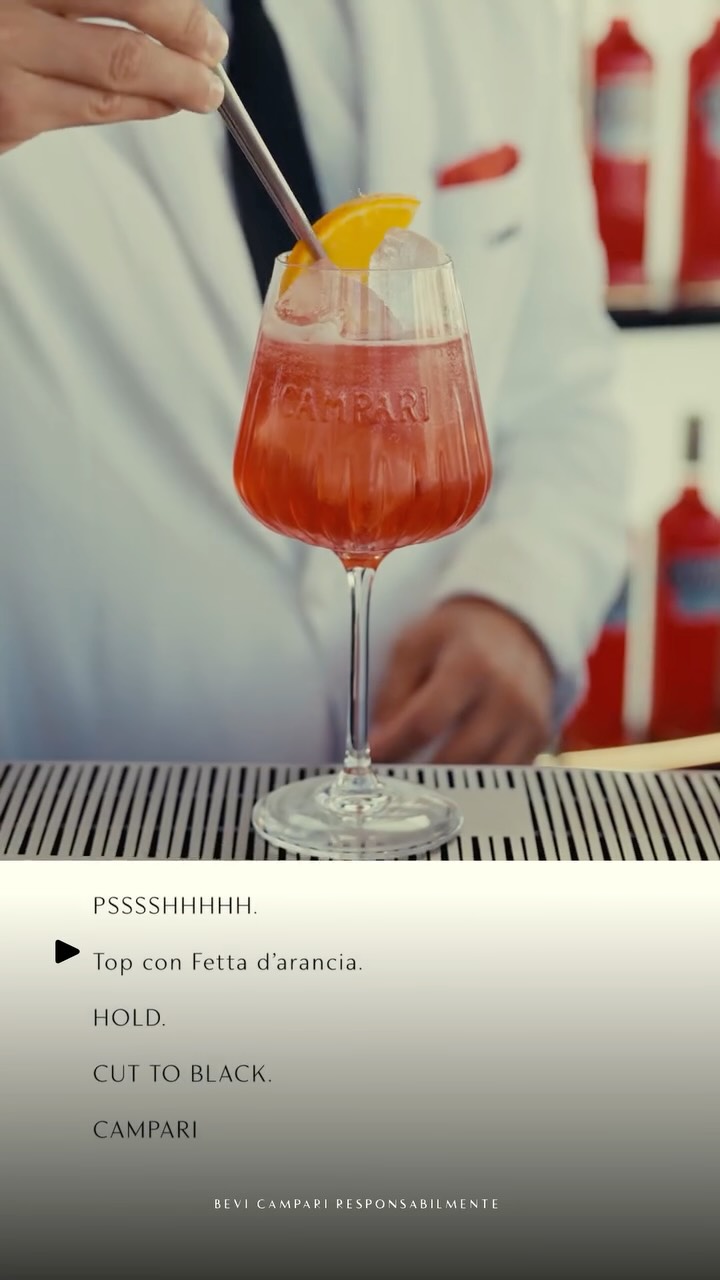
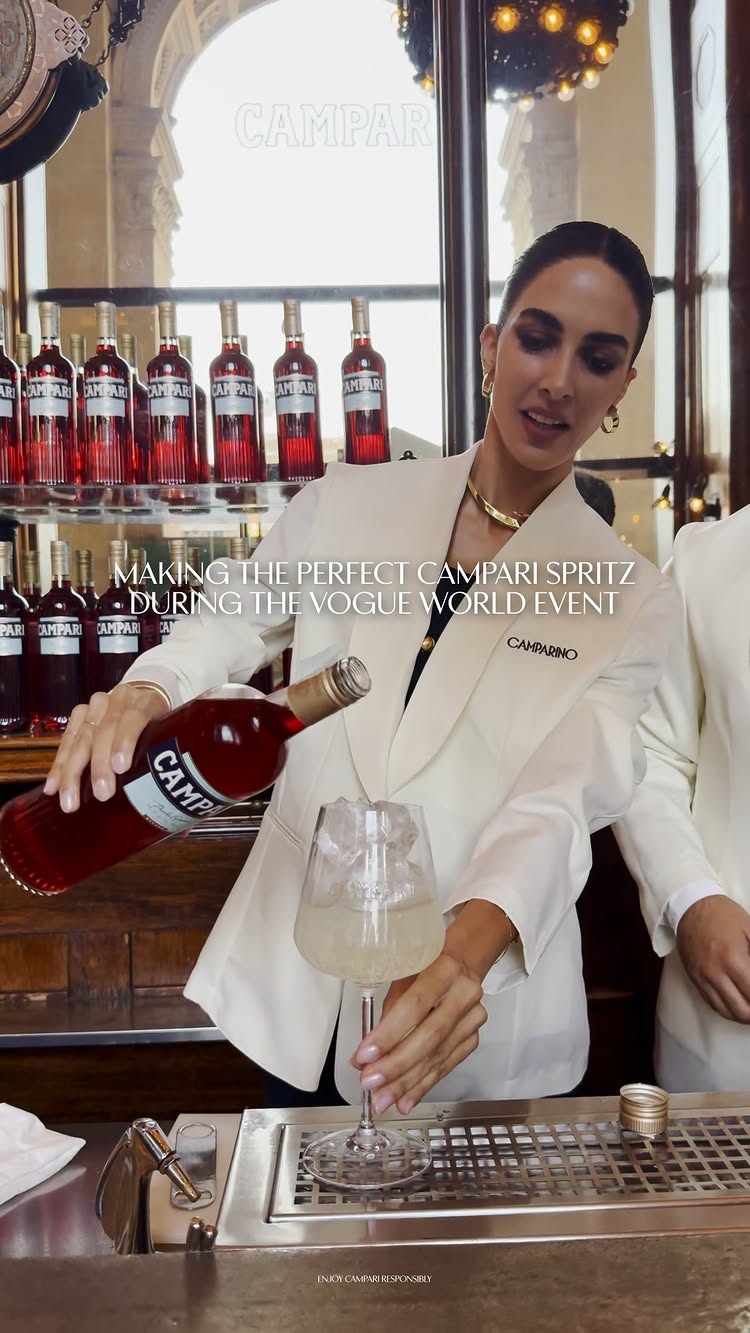
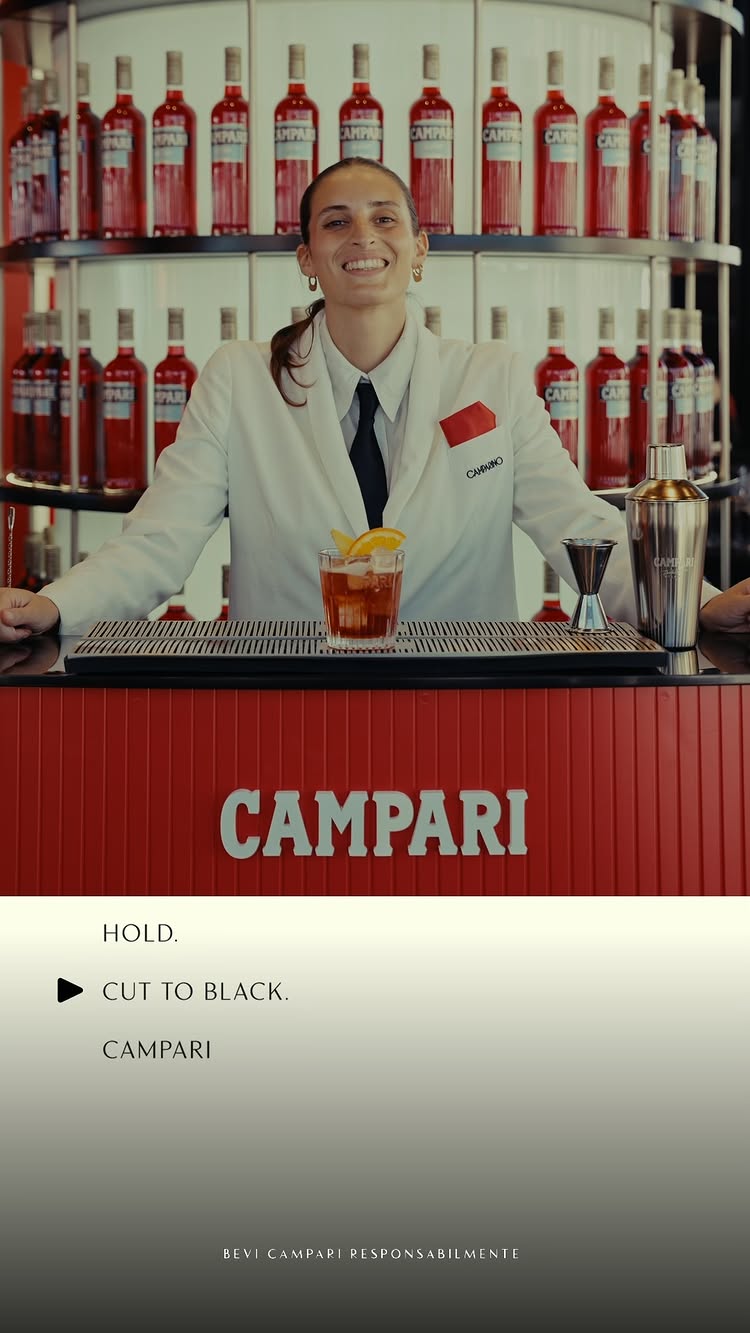
The profile shares cocktail recipes, bar scenes, and cinema-festival coverage. Its style pairs polished product imagery with interviews and event storytelling.

Written by a language model from the captions and images of the latest posts.

Engagement

0.44% on a typical post, 1.6% on average: one or two posts did most of the work. We don't rate engagement when they differ this much.

Reels reach
High

A typical reel gets 1.9M views, 19.2 times the follower count. 11 of 16 reels reached more people than follow the profile. More than 100% of accounts with 50K–500K followers.

Red flags
None raised

5 checks on likes, comments, following and reels reach. We do not check the followers themselves.

Activity
Active

Last post on November 11, 2026. Posts about 2 times a week.

Followers
96,229↑ +628 (+0.7%)
Likes per post
1.5K
Comments per post
21
Paid partnership labels
0 of 36 recent posts

Posts that worked

Brand work

Labeled partnerships

0 of the 36 recent posts are marked as paid partnerships on Instagram.

Collab co-authors

Brands and accounts in recent posts

  • Vogue World · named in caption

Own projects

  • Campari
  • Camparino in Galleria

Accounts tagged in posts

Engagement details

0.44% on a typical post, 1.6% on average.

Engagement

Average engagement rate
1.6%
Median engagement rate
0.44%
Posts measured
30

Likes and comments per post relative to followers. A median well below the average means a few viral posts lift the average.

How we calculate this

Content proportions

Content type
Percentage
Reels
53.3%
Photos
46.7%

Photos

Median likes
459
Median comments
5
Engagement rate
1.6%
All numbers

Likes

  • Sum21K
  • Median459
  • Max15K
  • Avg1.5K
  • Min126

Comments

  • Sum157
  • Median5
  • Max80
  • Avg11
  • Min0

Reels

Median likes
424
Median comments
5
Median views
1.9M
Engagement rate
1.6%
All numbers

Likes

  • Sum24.5K
  • Median424
  • Max7K
  • Avg1.5K
  • Min144

Comments

  • Sum470
  • Median5
  • Max121
  • Avg29
  • Min1

Views

  • Sum24.6M
  • Median1.9M
  • Max3.8M
  • Avg1.5M
  • Min6.9K

Engagement per view: 0.10%

Median views: 1925% of followers

Red flags

None of our 5 checks raised a red flag. We do not check the followers themselves.

Comments per 1,000 likes
13.8
Likes variation between posts
198%
Following per follower
under 0.01

A warning is a reason to look closer, not proof: the checks are tuned to stay rare on real accounts.

How we calculate this

How the score is built

Account quality score (AQS) 66.5/100

Engagement vs similar accounts
43 / 100
Reels reach vs similar accounts
100 / 100
Posting activity
85 / 100
Profile completeness
80 / 100

How we calculate this

Follower growth

We started tracking this profile on November 12, 2026. Growth appears after the next update.

Content

Campari Italia's posts mostly cover Beer, Wine & Spirits, Television & Film and Restaurants, Food & Grocery.

Niche

Beer, Wine & Spirits
also Television & Film, Restaurants, Food & Grocery

Topics

  • cocktail recipes
  • cinema events
  • bartending
  • creative interviews
  • fashion and culture

Identified by AI from the captions and images of the latest posts.

Captions mostly in Italian

How this report was made

Built on November 17, 2026 from the public profile and its 30 most recent posts.

Engagement rate is likes plus comments per post divided by followers. Compared with accounts of the same size: 50K–500K followers. We can't see private accounts, follower lists, audience age, gender or location, and we can't count fake followers.

Full method

Is this your profile? Ask us to correct or remove this report.