@kanik_kitchen Instagram stats and engagement rate

Updated November 21, 2026 · 30 posts measured · How we calculate this

@kanik_kitchen
Brand · 14.6K followers · Restaurants, Food & Grocery

Engagement is average, while Reels reach is above average. The profile posts several times a week, making it suited to restaurant and food campaigns.

What the profile is about

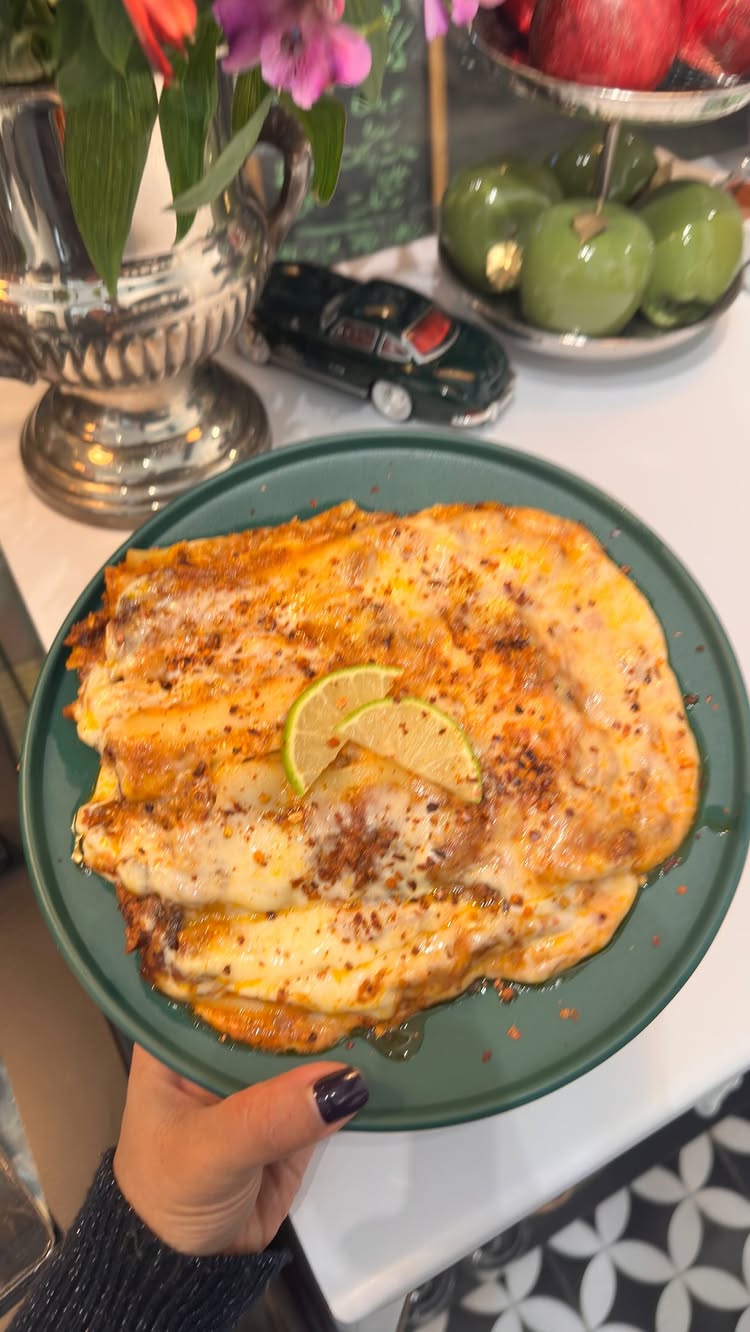
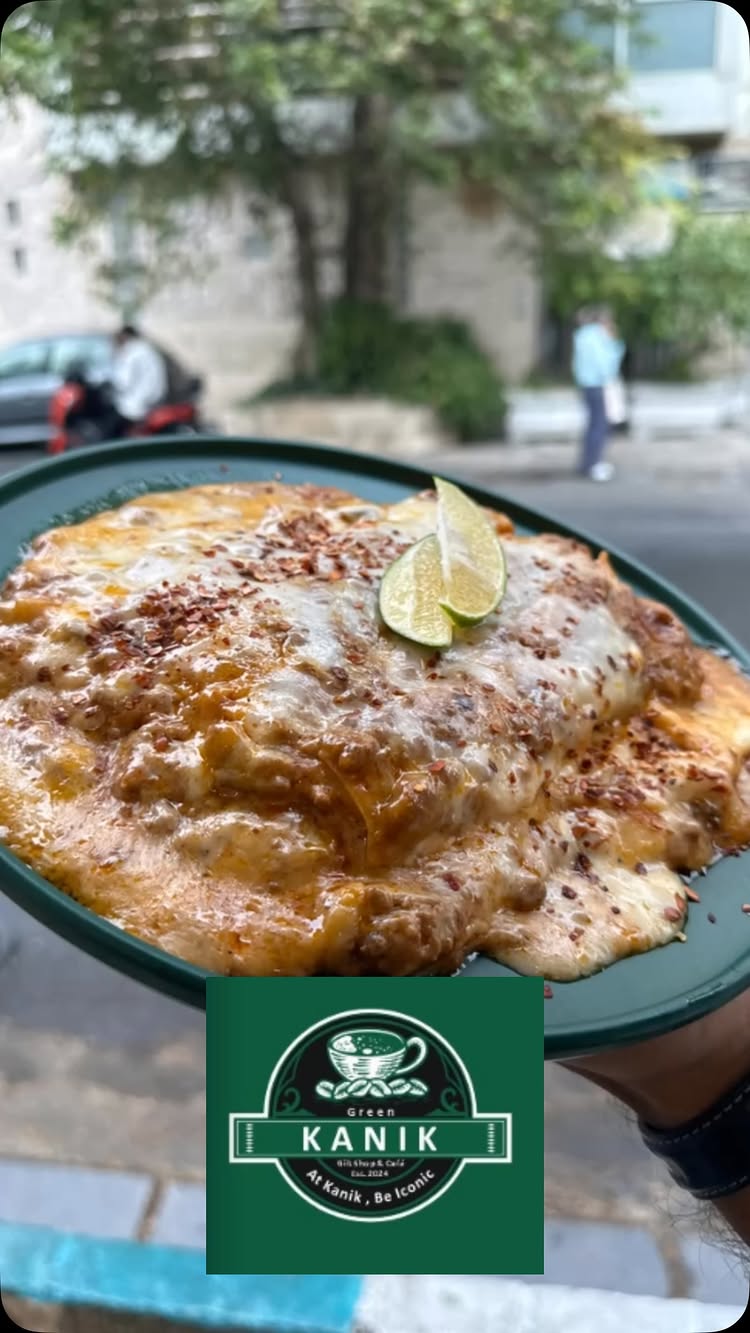
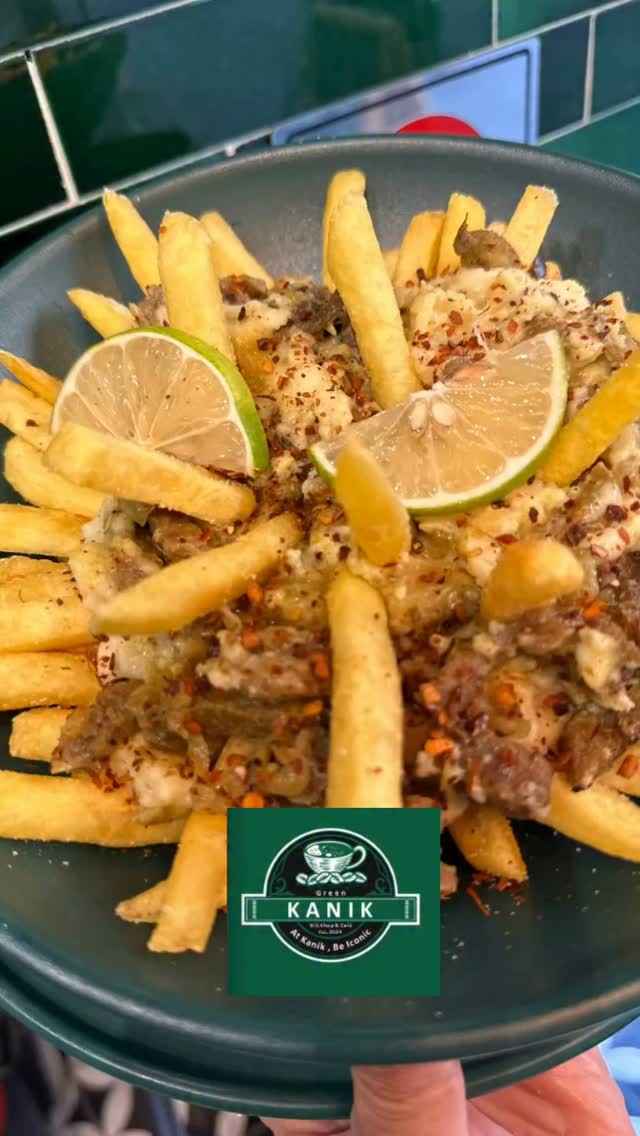
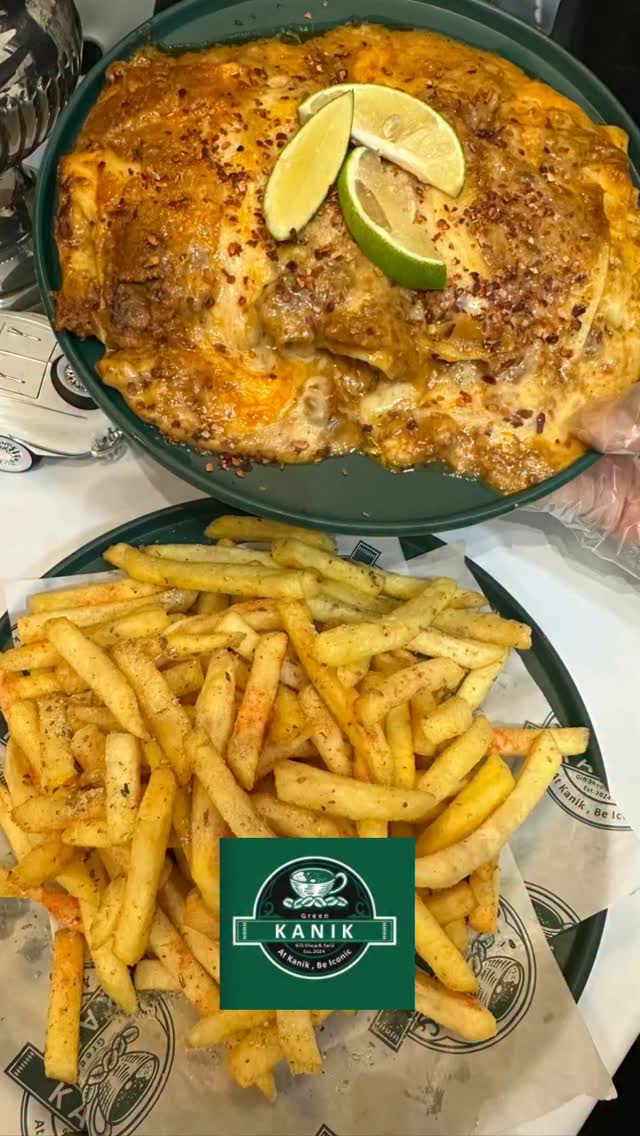
The profile shares restaurant dishes, especially lasagna and pasta, alongside menu updates and occasional décor posts. Its style mixes close-up food videos with personal, conversational captions in Persian.

Written by a language model from the captions and images of the latest posts.

Engagement
Average

0.86% on a typical post, 1.2% on average. Higher than 49% of accounts with 10K–50K followers.

Reels reach
Above average

A typical reel gets 5.1K views, 35% of the follower count. 3 of 21 reels reached more people than follow the profile. More than 63% of accounts with 10K–50K followers.

Red flags
None raised

5 checks on likes, comments, following and reels reach. We do not check the followers themselves.

Activity
Active

Last post on November 21, 2026. Posts about 4 times a week.

Followers
14,575
Likes per post
150
Comments per post
17
Paid partnership labels
0 of 36 recent posts

Posts that worked

Brand work

Brands and accounts in recent posts

  • Niri Organic · named in caption

Own projects

  • Kanik Kitchen

Accounts tagged in posts

Engagement details

0.86% on a typical post, 1.2% on average.

Engagement

Average engagement rate
1.2%
Median engagement rate
0.86%
Posts measured
30

Likes and comments per post relative to followers. Left out: 3 pinned, 2 very fresh. A median well below the average means a few viral posts lift the average.

How we calculate this

Content proportions

Content type
Percentage
Reels
70.0%
Photos
30.0%

Photos

Median likes
56
Median comments
3
Engagement rate
0.40%
All numbers

Likes

  • Sum491
  • Median56
  • Max96
  • Avg55
  • Min33

Comments

  • Sum37
  • Median3
  • Max12
  • Avg4
  • Min0

Reels

Median likes
129
Median comments
21
Median views
5.1K
Engagement rate
1.5%
All numbers

Likes

  • Sum4K
  • Median129
  • Max750
  • Avg191
  • Min77

Comments

  • Sum482
  • Median21
  • Max77
  • Avg23
  • Min0

Views

  • Sum152.2K
  • Median5.1K
  • Max32.5K
  • Avg7.2K
  • Min1.6K

Engagement per view: 3.0%

Median views: 35% of followers

Red flags

None of our 5 checks raised a red flag. We do not check the followers themselves.

Comments per 1,000 likes
115.1
Likes variation between posts
98%
Following per follower
0.014

A warning is a reason to look closer, not proof: the checks are tuned to stay rare on real accounts.

How we calculate this

How the score is built

Account quality score (AQS) 63.9/100

Engagement vs similar accounts
49 / 100
Reels reach vs similar accounts
63 / 100
Posting activity
100 / 100
Profile completeness
70 / 100

How we calculate this

Follower growth

We started tracking this profile on November 21, 2026. Growth appears after the next update.

Content

@kanik_kitchen's posts mostly cover Restaurants, Food & Grocery, Cooking & Recipes and Home Decor, Furniture & Garden.

Niche

Restaurants, Food & Grocery
also Cooking & Recipes, Home Decor, Furniture & Garden

Topics

  • lasagna
  • pasta dishes
  • restaurant updates
  • café drinks
  • restaurant décor

Identified by AI from the captions and images of the latest posts.
Captions mostly in Persian

How this report was made

Built on November 21, 2026 from the public profile and its 30 most recent posts.

Left out: 3 pinned, 2 very fresh. Engagement rate is likes plus comments per post divided by followers. Compared with accounts of the same size: 10K–50K followers. We can't see private accounts, follower lists, audience age, gender or location, and we can't count fake followers.

Full method

Is this your profile? Ask us to correct or remove this report.