Instagram Insights & Deep Analytics
for romansharf

romansharf

Roman Sharf | CEO of Luxury Bazaar

7.2K Posts
261.6K Followers
153 Following
North America
English
United States of America
Philadelphia
NoneJewellery & WatchesHealthy LifestyleBusiness & CareersLuxury GoodsActivewearFinance & InvestmentTechnology & InnovationSportsTelevision & FilmLuxury Travel
Watches • Jewelry • Business
⌚️Founder and CEO of @luxurybazaarofficial
📹 Home of the #GreyMarket YouTube series
▶️ More in link + reels

Report Generated on
October 4, 2025

Overall Insights

68.4%
Account Quality Score (AQS)
68.4% / 100%
2.1%
Engagement Rate (ER)
100K
Recent Likes
8.3K
Likes Per Post
903
Recent Comments
75
Comments Per Post
1.4M
Recent Views
117.3K
Views Per Post

Profile Summary

Executive Summary: Core audience: Luxury lifestyle enthusiasts focused on high-end watches and jewelry; affluent, business-minded, with interest in branding and premium experiences. Engagement health: solid reach (261k followers) with an engagement rate of 2.1%; high average likes (≈8.3k) and meaningful comments, strong video views (avg ≈117k) indicating quality engagement rather than mass-only impressions. Key niche: luxury timepieces, grey market content, and luxury branding, with a polished, corporate aesthetic and consistent production quality. Primary marketing strength: authentic authority in luxury watches and credible access to exclusive events/collections. Brand consideration: ensure alignment with luxury/non-conventional markets and verify long-term sponsorship fit beyond episodic promos.

Locations

Continents

Continent
Percentage
North America
100.0%

Countries

Country
Percentage
United States of America
100.0%

Cities

City
Percentage
Philadelphia
100.0%

Languages

Language
Percentage
English
100.0%

Metrics

Engagement Proportions

Metric
Percentage
Views
43.6%
Likes
35.4%
Comments
21.0%

Content Proportions

Content Type
Percentage
Reels
66.7%
Photos
33.3%
Videos
0.0%

Posting Dynamics

Posts per week: 0.1
Posts per month: 0.6
Average posting interval: 55 days
Consistency score: N/A
Most active day: Friday
Most active hour:18:00
Pattern: Low Activity
Weekday vs Weekend ratio: 1
Days since last post: N/A

Posts Insights

Photos

Likes

  • Sum1.6K
  • Median263
  • Max987
  • Avg390
  • Min48

Comments

  • Sum27
  • Median7
  • Max13
  • Avg7
  • Min1

Engagement Rate: 0.2%

Reels

Likes

  • Sum98.4K
  • Median811
  • Max91.1K
  • Avg12.3K
  • Min81

Comments

  • Sum876
  • Median29
  • Max489
  • Avg110
  • Min5

Views

  • Sum1.4M
  • Median30.7K
  • Max1.1M
  • Avg176K
  • Min6.7K

Engagement Rate: 3.0%

Content Metrics

Content Diversity
Score: 52.4%

Measures content variety across posts. High scores indicate a broad spectrum of topics and styles that attract diverse audience segments.

Brand Consistency
Score: 84.0%

Evaluates brand coherence across content. High scores indicate a recognizable style that builds audience trust and loyalty.

Content Depth
Score: 83.0%

Measures content complexity and layering. High scores indicate multi-dimensional themes that increase engagement time.

Content Structure
Score: 56.1%

Analyzes content organization. High scores indicate clear thematic clusters targeting different audience segments effectively.

Content Balance
Score: 97.8%

Evaluates content equilibrium across topics. High scores indicate even coverage without thematic overweighting.

Engagement Potential
Score: 39.3%

Predicts audience engagement capacity. High scores indicate content that stimulates active audience interaction and participation.

Content Maturity
Score: 17.3%

Measures content strategy sophistication. High scores indicate a professional approach to content creation and curation.

Viral Potential
Score: 31.9%

Evaluates content's viral capacity. High scores indicate presence of content that can achieve massive organic reach and sharing.

Audience Reach
Score: 4.3%

Measures potential audience coverage. High scores indicate content appealing to a broad spectrum of users across demographics.

Content Stability
Score: 87.5%

Evaluates content quality consistency. High scores indicate consistently high standards without dramatic quality drops.

Content Categories

interests

Metric
Percentage
Jewellery & Watches
13.2%
Healthy Lifestyle
12.8%
Business & Careers
12.0%
Luxury Goods
11.9%
Activewear
11.5%
Finance & Investment
10.2%
Technology & Innovation
8.7%
Sports
7.3%
Television & Film
6.4%
Luxury Travel
5.9%

visual composition

Metric
Percentage
Shallow Depth
41.5%
Dynamic Asymmetric
37.6%
Flat Lay
20.9%

lighting

Metric
Percentage
Natural Daylight
33.4%
LED Panel Setup
31.0%
Softbox Diffused
26.0%
Harsh Midday
9.6%

color palette

Metric
Percentage
Monochromatic
100.0%

people faces

Metric
Percentage
Posing for Camera
60.0%
Single Person
18.8%
Laughing & Smiling
13.6%
Family with Kids
4.1%
Serious & Contemplative
3.5%

products brands

Metric
Percentage
Brand Text
28.1%
Automotive
24.6%
Fitness & Sports
21.8%
Fashion & Clothing
10.8%
Luxury Goods
7.7%
Home Decor
6.5%
Product Focus
0.4%

environment

Metric
Percentage
Rooftop & Balcony
34.1%
Office Space
23.1%
Hotel & Luxury
16.8%
Park & Garden
14.5%
Home Interior
11.5%
Gym & Fitness
0.0%

production quality

Metric
Percentage
Blurry Out-of-Focus
38.9%
Professional Grading
35.3%
Heavily Edited
25.7%

aesthetics

Metric
Percentage
Corporate Business
100.0%

emotions

Metric
Percentage
Confident & Empowered
74.6%
Surprised & Excited
25.4%

mood atmosphere

Metric
Percentage
Energetic Dynamic
31.1%
Inspiring Motivational
24.3%
Tense Dramatic
16.1%
Professional Business
14.9%
Serious Formal
13.7%

commercial intent

Metric
Percentage
Highly Commercial
38.5%
Clear Sales Intent
29.2%
Brand Collaboration
20.0%
Product Advertisement
10.3%
Testimonial Review
1.3%
Influencer Sponsored
0.7%

sponsorship

Metric
Percentage
Exclusive Access
52.7%
Brand Event
21.1%
Paid Partnership
14.2%
Obvious Sponsorship
6.6%
Subtle Partnership
4.3%
Brand Ambassador
1.1%

brand alignment

Metric
Percentage
Fitness Health Values
29.6%
Luxury Brand Values
22.8%
Sustainability Values
17.3%
Family Parent Values
16.2%
Technology Values
10.5%
Youth Gen-Z Values
3.6%

engagement potential

Metric
Percentage
High Stopping Power
42.2%
Comment Generator
25.8%
Share Worthy
12.9%
Polarizing Content
12.9%
Tutorial How-to
6.2%

target audience

Metric
Percentage
Luxury Lifestyle
28.6%
Fitness Enthusiasts
12.3%
Tech & Gadgets
11.5%
Professionals
10.3%
Millennials (25-40)
8.9%
Sustainability
8.2%
Gen-X (41-55)
6.7%
Pet Lovers
6.2%
Food & Cooking
5.6%
Beauty & Fashion
1.7%

content strategy

Metric
Percentage
Promotional Content
37.2%
Seasonal Holiday
17.6%
Instagram Reels
16.7%
Cross-Platform
13.7%
Instagram Stories
7.5%
Entertainment Content
3.9%
Brand Awareness
3.4%

Content Focus

Aesthetic Avg12.6
Professional Avg10.3

Mentions

Hashtags

Top Posts

Luxury Bazaar
romansharf post
91.1K Likes • 489 Comments
February 5, 2024 at 06:23 PM

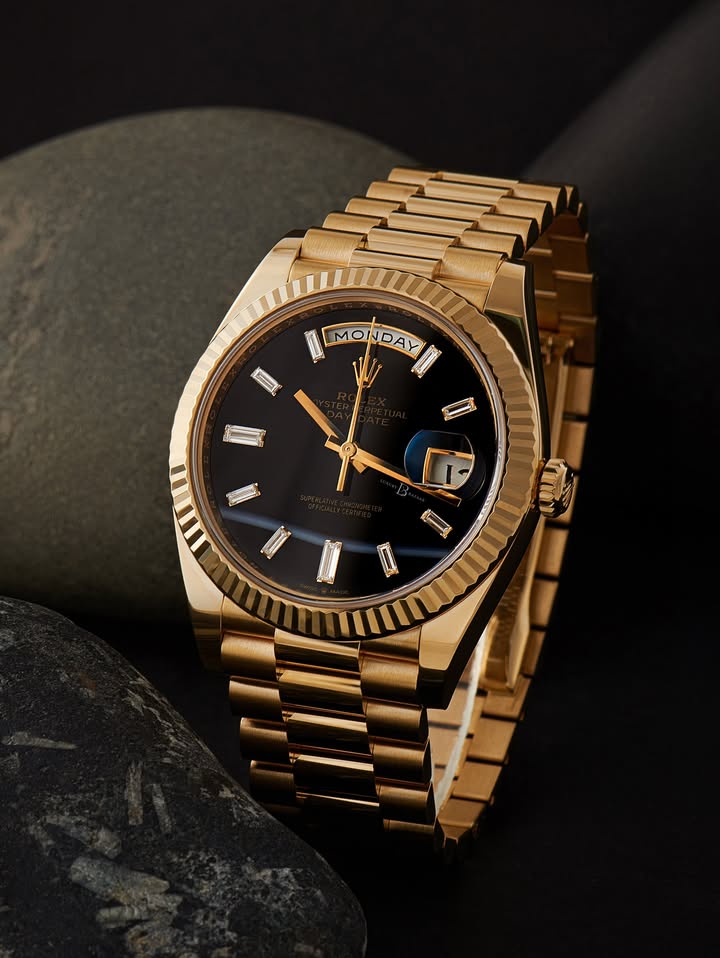
What does a watch mean to you?

To some, it’s to show success… to show their wealth…

But to me… it’s worth so much more

——

#luxurywatches
#rolexwatch
#watchcollection

romansharf post
3.6K Likes • 198 Comments
March 26, 2024 at 07:40 PM
Caption
Luxury Bazaar
romansharf post
1.7K Likes • 108 Comments
August 15, 2025 at 05:26 PM

With Geneva Watch Days coming up, this is every guy who buys independents. Shoutout to @mattslyon for the inspo, the guy’s hilarious 🔥

-
#genevawatchdays #watches

romansharf post
1.4K Likes • 37 Comments
October 1, 2025 at 09:42 PM

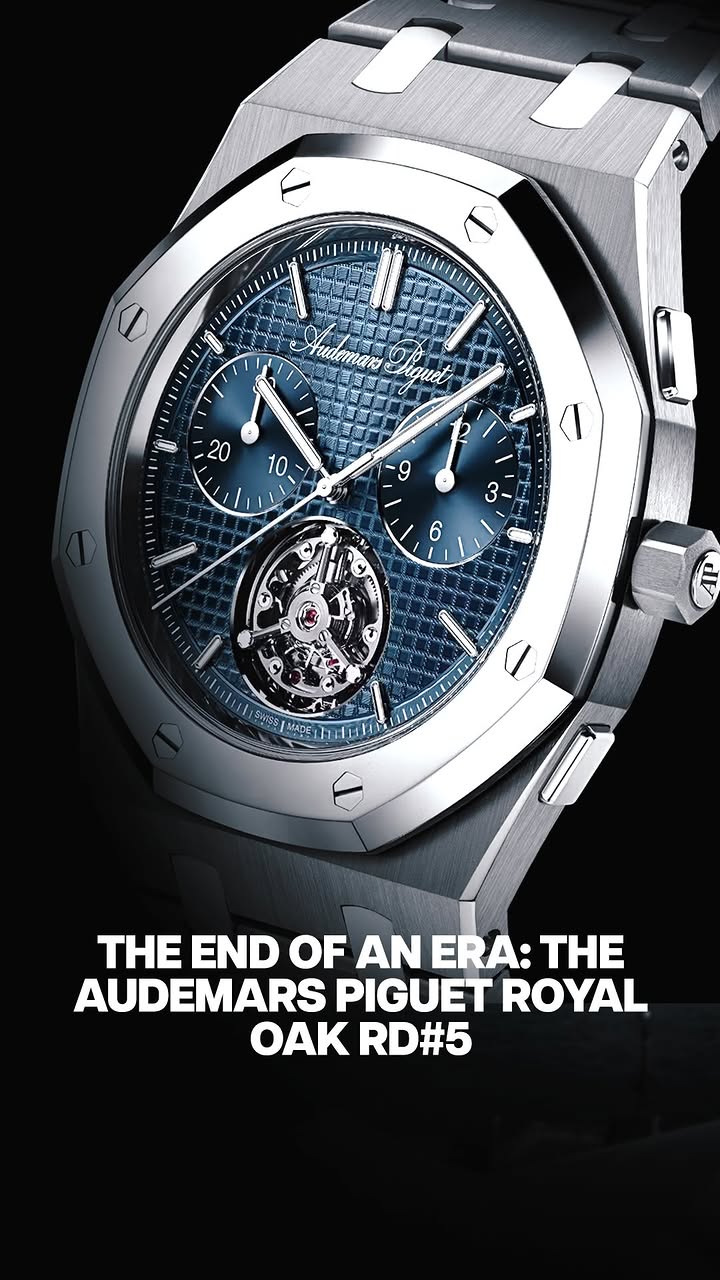
AP went out with a bang 💥 The final RD is not just a Jumbo, it’s a chronograph and a flying tourbillon packed into a case only 8.1mm thick.

What do you guys think? 🤔

romansharf post
987 Likes • 13 Comments
October 3, 2025 at 11:28 AM
Caption
romansharf post
370 Likes • 11 Comments
October 3, 2025 at 06:05 PM

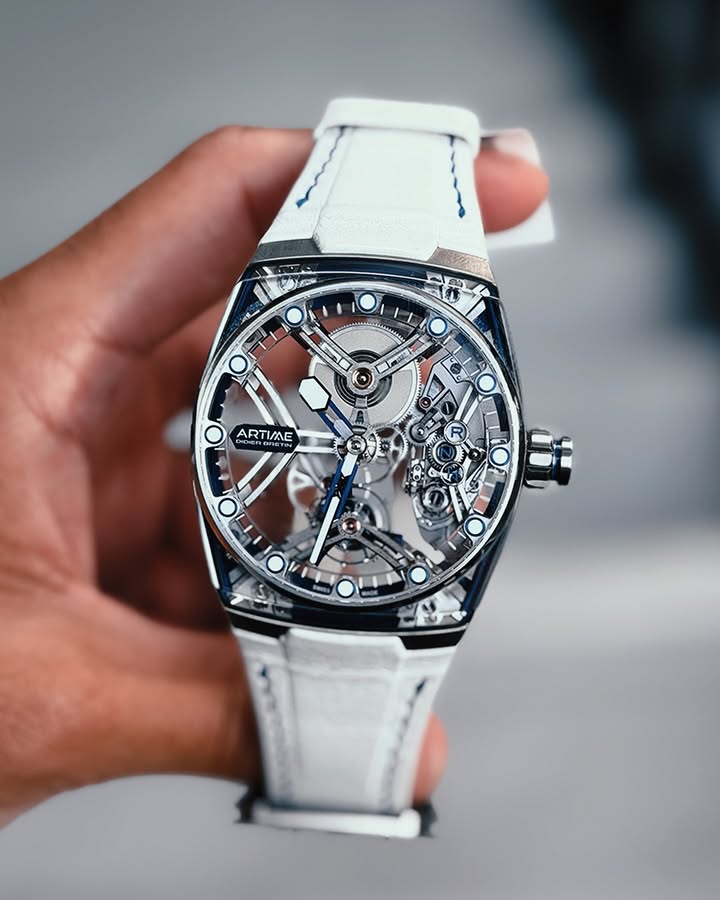
This Artime already had me. Sapphire case middle, double balance springs, flying tourbillon on display.

Then @nowaitlist’s took these and just… wow 🤯

Previous Analyses by LookFluence