Instagram Insights & Deep Analytics
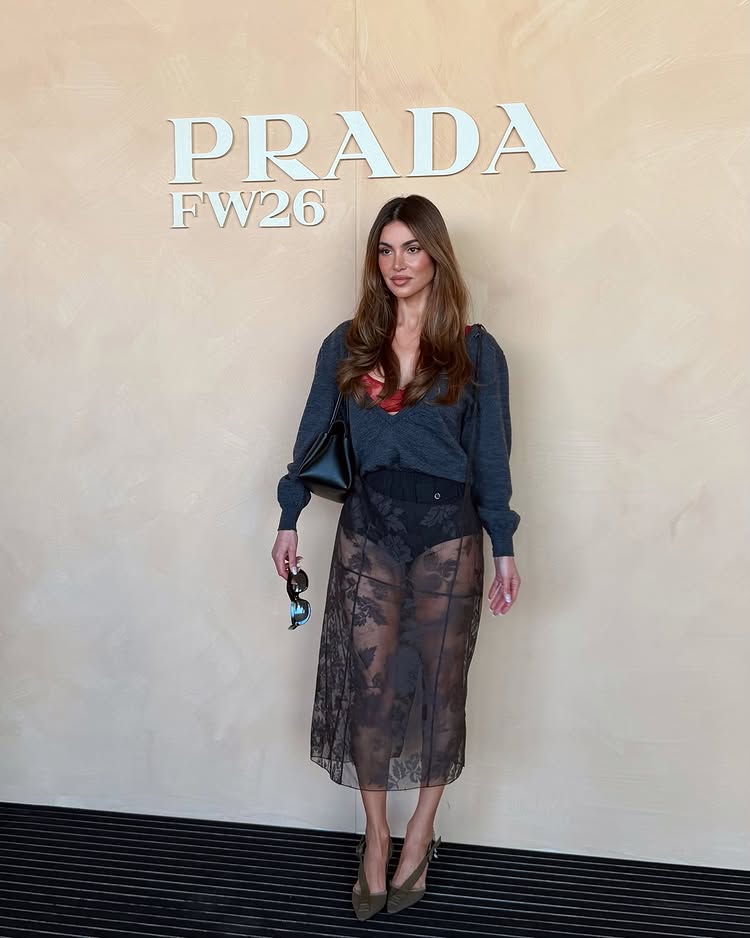
for negin_mirsalehi

negin_mirsalehi

Negin Mirsalehi

8K Posts
7.1M Followers
1.1K Following
Europe
English
France
Annecy
Beauty & CosmeticsStreet Style & FashionLuxury GoodsActivewearLuxury TravelClothes, Shoes, Handbags & AccessoriesOtherHealthy LifestyleRestaurants, Food & GroceryTravel, Tourism & Aviation
co-founder @gisou 🍯

3 days since last post

Report Generated on
April 3, 2026

Overall Insights

85.3%
Account Quality Score (AQS)
85.3% / 100%
0.0%
Engagement Rate (ER)
534.4K
Recent Likes
44.5K
Likes Per Post
4.4K
Recent Comments
371
Comments Per Post
0
Recent Views
0
Views Per Post

Profile Summary

Executive Summary: Core audience profile: Predominantly luxury lifestyle followers, Gen-Z (18-24) overlap, and sustainability-minded consumers; global with strong English-language reach. Engagement health: Very high follower base (7.08M) with strong average likes (≈44.5k) and comments (≈371) per post, but reported engagement rate as Infinity (data issue) and low posting consistency (pattern: moderate_irregular; 2.4 posts/week). Key content niche: Beauty, fashion/luxury, travel lifestyle with monochrome aesthetics, natural lighting, and subtle brand integrations. Primary marketing strength: Established luxury credibility and lifestyle authority; consideration: verify and stabilize engagement metrics and posting cadence for predictable campaigns.

Locations

Continents

Continent
Percentage
Europe
100.0%

Countries

Country
Percentage
France
100.0%

Cities

City
Percentage
Annecy
100.0%

Languages

Language
Percentage
English
84.6%
Somali
7.7%
Portuguese
7.7%

Metrics

Engagement Proportions

Metric
Percentage
Likes
61.1%
Comments
38.9%
Views
0.0%

Content Proportions

Content Type
Percentage
Photos
75.0%
Reels
25.0%
Videos
0.0%

Posting Dynamics

Posts per week: 2.4
Posts per month: 10.3
Average posting interval: 3 days
Consistency score: 7.2
Most active day: Sunday
Most active hour:16:00
Pattern: moderate_irregular
Weekday vs Weekend ratio: 0
Days since last post: 3

Posts Insights

Photos

Likes

  • Sum475.3K
  • Median58.1K
  • Max118.2K
  • Avg52.8K
  • Min3

Comments

  • Sum3.5K
  • Median229
  • Max1.6K
  • Avg394
  • Min182

Engagement Rate: 0.8%

Content Metrics

Content Diversity
Score: 39.7%

Measures content variety across posts. High scores indicate a broad spectrum of topics and styles that attract diverse audience segments.

Brand Consistency
Score: 87.3%

Evaluates brand coherence across content. High scores indicate a recognizable style that builds audience trust and loyalty.

Content Depth
Score: 80.6%

Measures content complexity and layering. High scores indicate multi-dimensional themes that increase engagement time.

Content Structure
Score: 54.7%

Analyzes content organization. High scores indicate clear thematic clusters targeting different audience segments effectively.

Content Balance
Score: 98.0%

Evaluates content equilibrium across topics. High scores indicate even coverage without thematic overweighting.

Engagement Potential
Score: 30.0%

Predicts audience engagement capacity. High scores indicate content that stimulates active audience interaction and participation.

Content Maturity
Score: 23.1%

Measures content strategy sophistication. High scores indicate a professional approach to content creation and curation.

Viral Potential
Score: 18.3%

Evaluates content's viral capacity. High scores indicate presence of content that can achieve massive organic reach and sharing.

Audience Reach
Score: 3.7%

Measures potential audience coverage. High scores indicate content appealing to a broad spectrum of users across demographics.

Content Stability
Score: 90.9%

Evaluates content quality consistency. High scores indicate consistently high standards without dramatic quality drops.

Content Categories

interests

Metric
Percentage
Beauty & Cosmetics
16.7%
Street Style & Fashion
16.1%
Luxury Goods
15.3%
Activewear
9.7%
Luxury Travel
9.2%
Clothes, Shoes, Handbags & Accessories
8.5%
Other
7.1%
Healthy Lifestyle
6.7%
Restaurants, Food & Grocery
5.5%
Travel, Tourism & Aviation
5.1%

visual composition

Metric
Percentage
Frame within Frame
52.7%
Shallow Depth
32.5%
Busy & Cluttered
13.7%
Centered & Symmetric
1.2%

lighting

Metric
Percentage
Natural Daylight
79.5%
Ring Light Beauty
20.5%

color palette

Metric
Percentage
Monochromatic
85.8%
Neutral Earth Tones
14.2%

people faces

Metric
Percentage
Posing for Camera
17.3%
Casual Lifestyle
14.6%
Couple
12.1%
Mature Adult
11.0%
Young Adult
10.0%
Single Person
9.9%
Candid Natural
8.8%
Children
7.7%
Relaxed Casual
6.4%
Action & Movement
2.2%

products brands

Metric
Percentage
Lifestyle Context
20.5%
Subtle Integration
13.1%
Fashion & Clothing
12.5%
Luxury Goods
12.0%
Brand Text
9.9%
Visible Logos
9.7%
Branded Packaging
7.6%
Beauty & Cosmetics
6.0%
Obvious Placement
5.4%
Fitness & Sports
3.2%

environment

Metric
Percentage
Nature & Outdoors
24.3%
Rooftop & Balcony
20.5%
Travel & Vacation
20.5%
Home Interior
12.4%
Gym & Fitness
10.2%
Park & Garden
4.2%
Office Space
4.1%
Casual Everyday
3.9%

production quality

Metric
Percentage
Social Media Style
36.1%
Blurry Out-of-Focus
33.7%
Heavily Edited
14.3%
Professional Grading
10.6%
Spontaneous
5.3%

aesthetics

Metric
Percentage
Balanced & Harmonious
31.3%
Trendy Modern
25.1%
Elegant Sophisticated
20.5%
Maximalist Busy
11.6%
Artistic Creative
7.3%
Contemporary Modern
4.2%

emotions

Metric
Percentage
Confident & Empowered
31.1%
Playful & Mischievous
24.2%
Happy & Joyful
16.3%
Romantic & Loving
15.8%
Neutral & Calm
7.5%
Mysterious & Intriguing
5.1%

mood atmosphere

Metric
Percentage
Peaceful Calm
24.8%
Fun Playful
23.6%
Luxury Premium
16.6%
Inspiring Motivational
15.2%
Casual Relaxed
7.4%
Tense Dramatic
6.8%
Energetic Dynamic
4.5%
Romantic Intimate
0.9%
Adventure Exciting
0.2%

commercial intent

Metric
Percentage
Influencer Sponsored
29.9%
Brand Awareness
14.3%
User-Generated
14.3%
Brand Collaboration
12.4%
Testimonial Review
10.8%
Subtly Commercial
7.1%
Educational Content
4.8%
Clear Sales Intent
4.6%
Personal Non-Commercial
1.9%

sponsorship

Metric
Percentage
Exclusive Access
23.6%
Subtle Partnership
19.1%
Paid Partnership
14.5%
Co-Branded Content
11.8%
Affiliate Marketing
7.6%
Obvious Sponsorship
6.9%
Brand Ambassador
6.8%
Brand Event
6.5%
Collaboration Styling
3.2%

brand alignment

Metric
Percentage
Luxury Brand Values
23.3%
Youth Gen-Z Values
18.9%
Sustainability Values
16.3%
Forced Placement
12.0%
Misaligned Association
10.1%
Family Parent Values
9.2%
Technology Values
5.2%
Fitness Health Values
4.3%
Authentic Integration
0.7%

engagement potential

Metric
Percentage
Polarizing Content
24.2%
Tutorial How-to
22.9%
Viral Potential
22.6%
User-Generated Appeal
19.8%
High Stopping Power
6.7%
Comment Generator
3.7%

target audience

Metric
Percentage
Luxury Lifestyle
21.6%
Gen-Z (18-24)
18.7%
Sustainability
13.8%
Tech & Gadgets
12.3%
Millennials (25-40)
10.9%
Beauty & Fashion
8.1%
Fitness Enthusiasts
5.5%
Professionals
4.9%
Gen-X (41-55)
3.2%
Travel Enthusiasts
1.1%

content strategy

Metric
Percentage
Seasonal Holiday
17.4%
Instagram Stories
14.0%
Instagram Reels
13.2%
Product Launch
10.8%
Influencer Collaboration
10.7%
Entertainment Content
9.1%
Personal Behind-Scenes
7.5%
Promotional Content
6.2%
Instagram Feed
6.2%
Inspirational Content
4.8%

Content Focus

Aesthetic Avg11.4
Professional Avg0.0

Mentions

Hashtags

Top Posts

negin_mirsalehi post
118.2K Likes • 1.6K Comments
March 9, 2026 at 04:33 PM

When I was pregnant with Maxi, all I could think about was feeling snow. Here we are ❄️☁️🤍

negin_mirsalehi post
65.4K Likes • 182 Comments
March 7, 2026 at 03:28 PM

Snow, good food and you. 🩵

negin_mirsalehi post
62.6K Likes • 265 Comments
March 29, 2026 at 03:37 PM

Not so patiently waiting for summer 🦋🩵🐬

negin_mirsalehi post
58.1K Likes • 366 Comments
February 27, 2026 at 02:50 PM

@prada!! LOVE! ❤️ #mfw

negin_mirsalehi post
58.1K Likes • 229 Comments
February 22, 2026 at 04:24 PM

Last dump from the sun. 💗

negin_mirsalehi post
52.7K Likes • 251 Comments
March 27, 2026 at 04:23 PM
Caption

Previous Analyses by LookFluence