Instagram Insights & Deep Analytics
for borodina

borodina

🌿Lera Borodina®🇺🇦🍃

3.1K Posts
319.5K Followers
1.2K Following
Europe
Ukrainian
France
Paris
Personal blogHealthy LifestyleBeauty & CosmeticsStreet Style & FashionOtherLuxury GoodsMeditation & MindfulnessRestaurants, Food & GroceryClothes, Shoes, Handbags & AccessoriesLuxury TravelActivewear
new season soon✨
Co-owner/CEO @g.bar.kyivnotkiev | G.Bar in 14 countries and @lavla.official @g.shop.me
навчаю в @nom.universe

14 days since last post

Report Generated on
October 4, 2025

Overall Insights

70.6%
Account Quality Score (AQS)
70.6% / 100%
2.7%
Engagement Rate (ER)
53.6K
Recent Likes
7.7K
Likes Per Post
662
Recent Comments
95
Comments Per Post
663.7K
Recent Views
94.8K
Views Per Post

Profile Summary

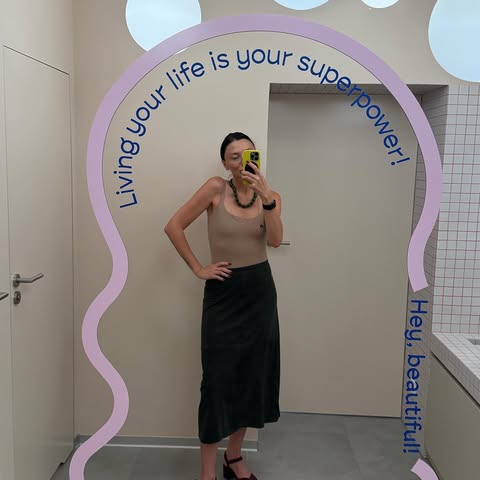
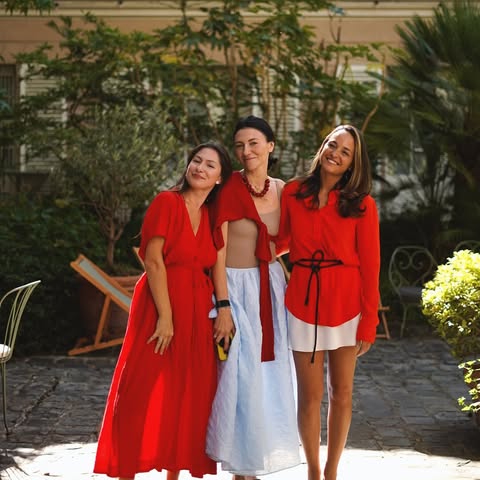
Executive summary: Borodina (🌿Lera Borodina) targets a premium, luxury-lifestyle audience with a strong tilt toward sustainability and beauty. Core audience: Ukrainian-speaking followers (primarily Ukrainian), fans of healthy living, beauty, and street style, engaging in luxury lifestyle and sustainability themes. Engagement health: solid rate at 2.7% with high like density (avg likes ~7.7k) and meaningful comments; growth potential via consistent, high-quality visuals (Monochrome, natural lighting, shallow depth). Niche: lifestyle/beauty with premium aesthetics, product launches, and motivational content; strong BTS/sponsorship fit. Primary strength: authentic, aspirational luxury lifestyle with sustainability alignment. Consideration: moderate posting cadence and multi-language reach to broaden global brand partnerships.

Locations

Continents

Continent
Percentage
Europe
100.0%

Countries

Country
Percentage
France
100.0%

Cities

City
Percentage
Paris
100.0%

Languages

Language
Percentage
Ukrainian
75.0%
English
12.5%
Estonian
12.5%

Metrics

Engagement Proportions

Metric
Percentage
Views
43.5%
Likes
35.4%
Comments
21.1%

Content Proportions

Content Type
Percentage
Photos
57.1%
Reels
42.9%
Videos
0.0%

Posting Dynamics

Posts per week: 0.9
Posts per month: 3.8
Average posting interval: 9 days
Consistency score: 21.0
Most active day: Friday
Most active hour:9:00
Pattern: Low Activity
Weekday vs Weekend ratio: 0
Days since last post: 14

Posts Insights

Photos

Likes

  • Sum40.7K
  • Median8.7K
  • Max17.7K
  • Avg10.2K
  • Min5.7K

Comments

  • Sum386
  • Median64
  • Max224
  • Avg97
  • Min35

Engagement Rate: 3.2%

Reels

Likes

  • Sum12.9K
  • Median4.6K
  • Max6.1K
  • Avg4.3K
  • Min2.2K

Comments

  • Sum276
  • Median78
  • Max137
  • Avg92
  • Min61

Views

  • Sum663.7K
  • Median223.9K
  • Max224.6K
  • Avg221.2K
  • Min215.2K

Engagement Rate: 2.0%

Content Metrics

Content Diversity
Score: 49.7%

Measures content variety across posts. High scores indicate a broad spectrum of topics and styles that attract diverse audience segments.

Brand Consistency
Score: 91.7%

Evaluates brand coherence across content. High scores indicate a recognizable style that builds audience trust and loyalty.

Content Depth
Score: 75.6%

Measures content complexity and layering. High scores indicate multi-dimensional themes that increase engagement time.

Content Structure
Score: 55.6%

Analyzes content organization. High scores indicate clear thematic clusters targeting different audience segments effectively.

Content Balance
Score: 97.5%

Evaluates content equilibrium across topics. High scores indicate even coverage without thematic overweighting.

Engagement Potential
Score: 36.9%

Predicts audience engagement capacity. High scores indicate content that stimulates active audience interaction and participation.

Content Maturity
Score: 37.5%

Measures content strategy sophistication. High scores indicate a professional approach to content creation and curation.

Viral Potential
Score: 21.7%

Evaluates content's viral capacity. High scores indicate presence of content that can achieve massive organic reach and sharing.

Audience Reach
Score: 3.5%

Measures potential audience coverage. High scores indicate content appealing to a broad spectrum of users across demographics.

Content Stability
Score: 93.4%

Evaluates content quality consistency. High scores indicate consistently high standards without dramatic quality drops.

Content Categories

interests

Metric
Percentage
Healthy Lifestyle
25.8%
Beauty & Cosmetics
20.4%
Street Style & Fashion
13.6%
Other
10.1%
Luxury Goods
10.1%
Meditation & Mindfulness
4.3%
Restaurants, Food & Grocery
4.3%
Clothes, Shoes, Handbags & Accessories
4.1%
Luxury Travel
4.0%
Activewear
3.3%

visual composition

Metric
Percentage
Shallow Depth
100.0%

lighting

Metric
Percentage
Natural Daylight
100.0%

color palette

Metric
Percentage
Monochromatic
100.0%

people faces

Metric
Percentage
Posing for Camera
24.8%
Single Person
24.2%
Mature Adult
16.8%
Casual Lifestyle
16.0%
Couple
9.2%
Candid Natural
6.0%
Relaxed Casual
3.0%

products brands

Metric
Percentage
Lifestyle Context
25.9%
Subtle Integration
17.4%
Beauty & Cosmetics
16.0%
Fashion & Clothing
11.3%
Brand Text
9.2%
Luxury Goods
8.4%
Branded Packaging
8.1%
Unboxing Reveal
3.4%
Product Focus
0.3%

environment

Metric
Percentage
Rooftop & Balcony
53.1%
Office Space
21.6%
Home Interior
16.9%
Travel & Vacation
8.5%

production quality

Metric
Percentage
Social Media Style
53.3%
Blurry Out-of-Focus
25.3%
Professional Grading
9.6%
Heavily Edited
7.5%
Low Production Value
4.3%

aesthetics

Metric
Percentage
Trendy Modern
52.9%
Balanced & Harmonious
47.1%

emotions

Metric
Percentage
Confident & Empowered
100.0%

mood atmosphere

Metric
Percentage
Luxury Premium
40.1%
Inspiring Motivational
35.4%
Fun Playful
16.6%
Energetic Dynamic
3.6%
Casual Relaxed
3.2%
Professional Business
1.1%

commercial intent

Metric
Percentage
Subtly Commercial
36.4%
Behind-the-Scenes
17.2%
Personal Non-Commercial
14.7%
Brand Awareness
11.0%
Influencer Sponsored
9.2%
Testimonial Review
5.6%
Brand Collaboration
3.1%
User-Generated
2.8%

sponsorship

Metric
Percentage
Exclusive Access
36.4%
Subtle Partnership
20.5%
Affiliate Marketing
17.3%
Paid Partnership
14.8%
Brand Event
11.0%

brand alignment

Metric
Percentage
Sustainability Values
33.2%
Luxury Brand Values
31.5%
Youth Gen-Z Values
17.7%
Fitness Health Values
14.3%
Forced Placement
2.8%
Family Parent Values
0.4%

engagement potential

Metric
Percentage
Tutorial How-to
26.7%
Viral Potential
22.8%
Relatable Moments
17.9%
Polarizing Content
14.3%
Behind-the-Scenes
9.4%
Before & After
6.4%
User-Generated Appeal
2.3%

target audience

Metric
Percentage
Luxury Lifestyle
24.6%
Sustainability
21.9%
Fitness Enthusiasts
12.7%
Gen-Z (18-24)
12.6%
Millennials (25-40)
12.1%
Tech & Gadgets
8.4%
Professionals
5.6%
Beauty & Fashion
2.2%

content strategy

Metric
Percentage
Seasonal Holiday
17.0%
Product Launch
14.5%
Instagram Stories
13.4%
Instagram Reels
11.0%
Influencer Collaboration
9.9%
Instagram Feed
9.3%
Personal Behind-Scenes
8.0%
Promotional Content
7.8%
Entertainment Content
7.2%
Educational Content
1.8%

Content Focus

Aesthetic Avg14.8
Professional Avg0.0

Mentions

Hashtags

No data available

Top Posts

borodina post
17.7K Likes • 224 Comments
August 9, 2025 at 09:57 AM
Caption
Paris, France
borodina post
11.1K Likes • 61 Comments
September 19, 2025 at 10:37 AM
Caption
borodina post
6.2K Likes • 35 Comments
July 25, 2025 at 04:37 PM
Caption
borodina post
6.1K Likes • 78 Comments
July 27, 2025 at 09:28 AM

Лондон Unpacking 👇🏻
• туш @isamayabeauty
• блокнот @smythson
• форма @alo
• трошки @carebears
• сукня @acnestudios
• сережки @sy.solenne
• светшот @gymshark

borodina post
5.7K Likes • 66 Comments
August 31, 2025 at 06:16 PM
Caption
borodina post
4.6K Likes • 61 Comments
August 2, 2025 at 05:02 PM
Caption

Previous Analyses by LookFluence