Instagram Insights & Deep Analytics
for beyonce

beyonce

Beyoncé

2.4K Posts
307.6M Followers
1 Following
English
NoneOtherBusiness & CareersStreet Style & FashionClothes, Shoes, Handbags & AccessoriesLuxury TravelLuxury GoodsTechnology & InnovationTravel, Tourism & AviationHealthy LifestyleBeauty & Cosmetics

46 days since last post

Report Generated on
April 4, 2026

Overall Insights

74.9%
Account Quality Score (AQS)
74.9% / 100%
0.0%
Engagement Rate (ER)
17.2M
Recent Likes
1.4M
Likes Per Post
326.1K
Recent Comments
27.2K
Comments Per Post
0
Recent Views
0
Views Per Post

Profile Summary

Executive summary: Core audience profile: Ultra-large follower base (≈307.6M) with English-speaking, luxury lifestyle, Gen-Z-adjacent interests; emphasis on empowerment, sustainability, and brand-aligned prestige. Engagement health: Reported engagement rate as Infinity (likely data artifact) with high average likes (~1.43M) and comments (~27.2K); posting activity is very low (0.76 posts/week) but high-quality content signals strong engagement potential. Key content niche: Personal/behind-the-scenes entertainment with subtle brand integrations, luxury lifestyle aesthetics, and authority-driven moments (philanthropy, accolades). Primary marketing strength: Peak reach and aspirational authority; strong partnership potential via exclusive access and brand collaborations. Consideration: verify engagement metrics and ensure alignment with a high-end, socially conscious brand narrative.

Locations

Continents

No data available

Countries

No data available

Cities

No data available

Languages

Language
Percentage
English
100.0%

Metrics

Engagement Proportions

Metric
Percentage
Likes
56.8%
Comments
43.2%
Views
0.0%

Content Proportions

Content Type
Percentage
Photos
75.0%
Reels
25.0%
Videos
0.0%

Posting Dynamics

Posts per week: 0.8
Posts per month: 3.3
Average posting interval: 10 days
Consistency score: N/A
Most active day: Tuesday
Most active hour:10:00
Pattern: Low Activity
Weekday vs Weekend ratio: 0
Days since last post: 46

Posts Insights

Photos

Likes

  • Sum14.4M
  • Median1.6M
  • Max2.6M
  • Avg1.6M
  • Min818.5K

Comments

  • Sum241.5K
  • Median20.2K
  • Max59.6K
  • Avg26.8K
  • Min13.3K

Engagement Rate: 0.5%

Content Metrics

Content Diversity
Score: 40.7%

Measures content variety across posts. High scores indicate a broad spectrum of topics and styles that attract diverse audience segments.

Brand Consistency
Score: 81.7%

Evaluates brand coherence across content. High scores indicate a recognizable style that builds audience trust and loyalty.

Content Depth
Score: 83.3%

Measures content complexity and layering. High scores indicate multi-dimensional themes that increase engagement time.

Content Structure
Score: 57.7%

Analyzes content organization. High scores indicate clear thematic clusters targeting different audience segments effectively.

Content Balance
Score: 98.0%

Evaluates content equilibrium across topics. High scores indicate even coverage without thematic overweighting.

Engagement Potential
Score: 30.8%

Predicts audience engagement capacity. High scores indicate content that stimulates active audience interaction and participation.

Content Maturity
Score: 17.3%

Measures content strategy sophistication. High scores indicate a professional approach to content creation and curation.

Viral Potential
Score: 18.8%

Evaluates content's viral capacity. High scores indicate presence of content that can achieve massive organic reach and sharing.

Audience Reach
Score: 3.8%

Measures potential audience coverage. High scores indicate content appealing to a broad spectrum of users across demographics.

Content Stability
Score: 87.3%

Evaluates content quality consistency. High scores indicate consistently high standards without dramatic quality drops.

Content Categories

interests

Metric
Percentage
Other
15.9%
Business & Careers
13.8%
Street Style & Fashion
12.9%
Clothes, Shoes, Handbags & Accessories
10.6%
Luxury Travel
9.6%
Luxury Goods
9.4%
Technology & Innovation
8.8%
Travel, Tourism & Aviation
7.9%
Healthy Lifestyle
7.1%
Beauty & Cosmetics
4.0%

visual composition

Metric
Percentage
Frame within Frame
56.2%
Centered & Symmetric
43.8%

lighting

No data available

color palette

No data available

people faces

Metric
Percentage
Posing for Camera
38.5%
Single Person
22.7%
Multiple People
22.1%
Candid Natural
8.7%
Mature Adult
7.8%
Laughing & Smiling
0.3%

products brands

Metric
Percentage
Subtle Integration
23.2%
Visible Logos
12.2%
Brand Text
11.5%
Fashion & Clothing
11.3%
Lifestyle Context
10.8%
Branded Packaging
9.1%
Unboxing Reveal
9.1%
Product Focus
5.5%
Obvious Placement
3.8%
Luxury Goods
3.5%

environment

Metric
Percentage
Rooftop & Balcony
29.8%
Office Space
23.5%
Park & Garden
21.9%
Gym & Fitness
12.2%
Home Interior
8.9%
Hotel & Luxury
3.6%

production quality

Metric
Percentage
Blurry Out-of-Focus
43.8%
Heavily Edited
39.4%
Social Media Style
11.0%
Professional Grading
5.7%

aesthetics

Metric
Percentage
Balanced & Harmonious
61.8%
Artistic Creative
38.2%

emotions

Metric
Percentage
Confident & Empowered
43.3%
Angry & Frustrated
20.2%
Disgusted & Displeased
12.9%
Playful & Mischievous
11.6%
Mysterious & Intriguing
10.3%
Happy & Joyful
1.7%

mood atmosphere

Metric
Percentage
Energetic Dynamic
29.3%
Inspiring Motivational
28.4%
Tense Dramatic
20.2%
Positive Uplifting
14.5%
Fun Playful
4.7%
Peaceful Calm
2.9%

commercial intent

Metric
Percentage
Brand Awareness
39.1%
Influencer Sponsored
36.5%
Brand Collaboration
20.7%
Educational Content
3.7%

sponsorship

Metric
Percentage
Exclusive Access
30.4%
Subtle Partnership
19.9%
Co-Branded Content
16.8%
Brand Event
13.5%
Paid Partnership
8.2%
Collaboration Styling
7.5%
Obvious Sponsorship
3.7%

brand alignment

Metric
Percentage
Fitness Health Values
18.7%
Luxury Brand Values
16.1%
Youth Gen-Z Values
14.8%
Sustainability Values
13.0%
Forced Placement
11.3%
Family Parent Values
11.1%
Misaligned Association
9.4%
Technology Values
5.7%

engagement potential

Metric
Percentage
Viral Potential
25.2%
Comment Generator
18.8%
Polarizing Content
17.9%
Share Worthy
16.8%
Tutorial How-to
10.5%
Before & After
7.5%
Behind-the-Scenes
3.0%
Relatable Moments
0.4%

target audience

Metric
Percentage
Sustainability
19.3%
Luxury Lifestyle
18.8%
Gen-Z (18-24)
14.3%
Fitness Enthusiasts
13.4%
Beauty & Fashion
8.5%
Tech & Gadgets
8.4%
All Age Groups
6.6%
Millennials (25-40)
6.2%
Professionals
3.8%
Food & Cooking
0.7%

content strategy

Metric
Percentage
Instagram Feed
13.4%
Personal Behind-Scenes
13.1%
Entertainment Content
12.9%
Seasonal Holiday
12.2%
Instagram Reels
11.4%
Product Launch
10.1%
Instagram Stories
9.0%
Inspirational Content
7.9%
Promotional Content
6.2%
Influencer Collaboration
3.8%

Content Focus

Aesthetic Avg8.7
Professional Avg11.3

Mentions

No data available

Hashtags

Top Posts

beyonce post
2.6M Likes • 18K Comments
October 28, 2025 at 05:39 AM

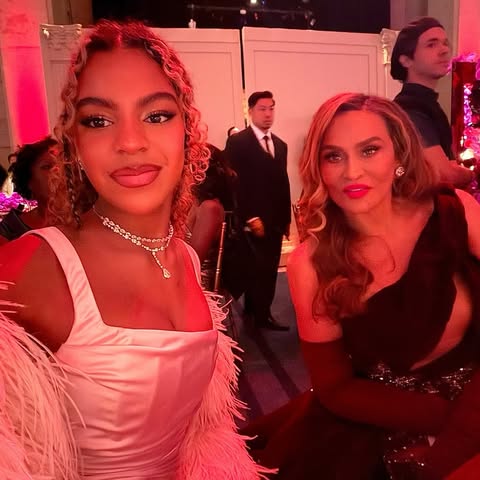
Congrats Mom on your philanthropy award at the Angel Ball tonight ❤️

beyonce post
2.2M Likes • 59.6K Comments
February 13, 2026 at 01:41 AM

beyonce post
1.7M Likes • 28.5K Comments
November 25, 2025 at 08:47 AM

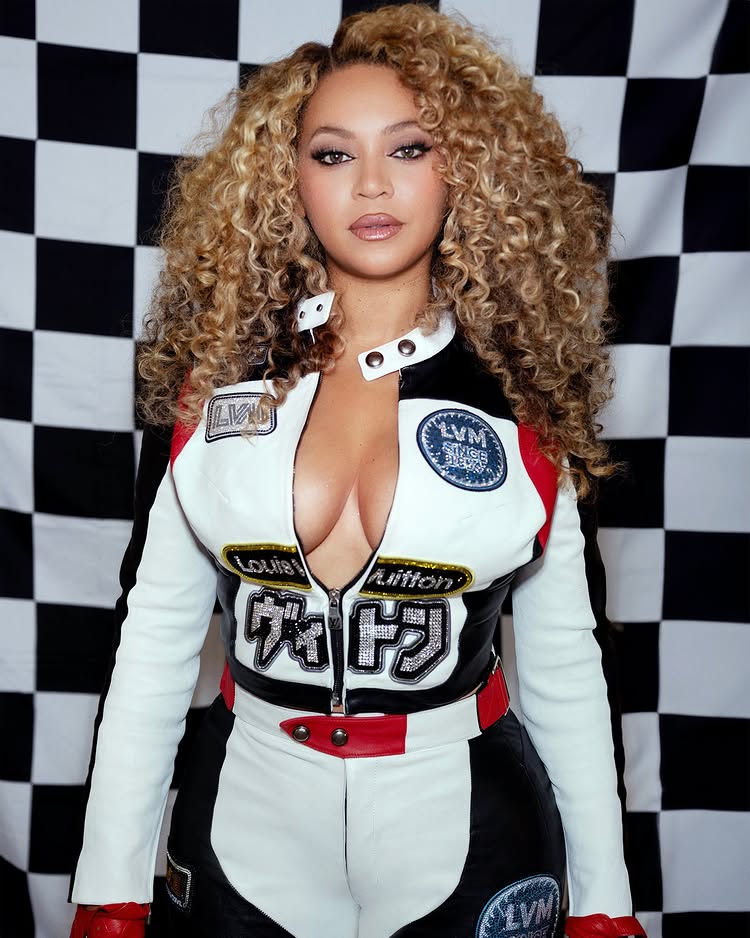
Love and gratitude to the best to ever do it! Lewis Hamilton #44!

beyonce post
1.7M Likes • 13.3K Comments
November 22, 2025 at 10:15 AM

Drip broke the levee when my Kelly’s roll in

beyonce post
1.6M Likes • 16.1K Comments
February 11, 2026 at 06:26 PM

#RelationshipGoals
Happy Birthday Kelly ❤️

beyonce post
1.4M Likes • 30.3K Comments
February 16, 2026 at 02:16 AM

Previous Analyses by LookFluence